Influenza Disease Counts
This project aimed to visualize and find interesting trends in the historical instance and geographical distribution of Influenza. tldr; a pretty graph:
Analyzing the Influenza Dataset
The influenza dataset was downloaded here from the Tycho Project along with the relevant metadata in data/influenza/US/*.
import sys
import pandas

file_loc = 'data/influenza/US/US.6142004.csv'
df = pandas.read_csv(
    file_loc,
    low_memory=False,
    parse_dates=['PeriodStartDate', 'PeriodEndDate'],
    date_parser=lambda x: pandas.datetime.strptime(x, '%Y-%m-%d')
)
We notice a few things about the dataset:
- There is only one PathogenName in the dataset (‘unidentified influenza virus’)
- There is only one AgeRange in the dataset (‘0-130’)
- There are no DiagnosisCertainty values (‘nan’, (‘NA)
- The CountValue column is sometimes a “Cummulative” value
- See the dataset readme under ‘Separate cumulative from non-cumulative time interval series’
- The PartOfCumulativeCountSeries is not provided in this dataset
pandas.unique(df[['PathogenName', 'AgeRange', 'DiagnosisCertainty']].values.ravel('K'))
array(['unidentified influenza virus', '0-130', nan], dtype=object)
Sanitizing the Dataset
We need to sanitize the dataset to show instance counts in non-overlapping date ranges to make aggregate analysis more simple. To do so, we first see if rows in the dataset actually do contain overlapping date intervals.
Verifying Overlaps Exist
from src.lib.parse import overlaps, combine_rows

# these are the columns used to determine
#  if two rows should be checked for overlapping date ranges
# *in order* (least to most specific)
match_on = [
    'Admin1ISO',
    'Admin2Name',
    'CityName',
    'Fatalities'
]

sort_by = ['PeriodStartDate']
found = overlaps(df, match_on, sort_by)
dupes = pandas.DataFrame(f[1][1] for f in found)
dupes.sort_values(by=['CountValue','CityName'], ascending=False)[[
    'CityName',
    'PeriodStartDate',
    'PeriodEndDate',
    'CountValue'
]]
| CityName | PeriodStartDate | PeriodEndDate | CountValue | |
|---|---|---|---|---|
| 169694 | LOS ANGELES | 1937-05-23 | 1937-05-29 | 15 |
| 45322 | CLEVELAND | 1923-11-05 | 1923-11-11 | 8 |
| 99914 | NEWARK | 1923-11-05 | 1923-11-11 | 7 |
| 81621 | SAVANNAH | 1937-05-23 | 1937-05-29 | 4 |
| 55066 | CHARLESTON | 1937-05-23 | 1937-05-29 | 4 |
| 38670 | PHILADELPHIA | 1923-11-05 | 1923-11-11 | 3 |
| 178278 | PORTLAND | 1937-05-23 | 1937-05-29 | 2 |
| 70307 | MINNEAPOLIS | 1937-05-23 | 1937-05-29 | 2 |
| 175022 | DALLAS | 1937-05-23 | 1937-05-29 | 2 |
| 152524 | BIRMINGHAM | 1937-05-23 | 1937-05-29 | 2 |
| 53820 | WASHINGTON | 1937-05-23 | 1937-05-29 | 1 |
| 189084 | TOPEKA | 1937-05-23 | 1937-05-29 | 1 |
| 179730 | SAN ANTONIO | 1937-05-23 | 1937-05-29 | 1 |
| 92656 | NASHVILLE | 1937-05-23 | 1937-05-29 | 1 |
| 217007 | MIAMI | 1937-05-23 | 1937-05-29 | 1 |
| 170996 | LOS ANGELES | 1937-05-23 | 1937-05-29 | 1 |
| 162759 | LITTLE ROCK | 1937-05-23 | 1937-05-29 | 1 |
| 153725 | BIRMINGHAM | 1937-05-23 | 1937-05-29 | 1 |
| 158250 | ATLANTA | 1937-05-23 | 1937-05-29 | 1 |
| 141785 | WINSTON-SALEM | 1937-05-23 | 1937-05-29 | 0 |
| 106457 | WILMINGTON | 1937-05-23 | 1937-05-29 | 0 |
| 159797 | WILMINGTON | 1937-05-23 | 1937-05-29 | 0 |
| 166853 | WICHITA | 1937-05-23 | 1937-05-29 | 0 |
| 59741 | WHEELING | 1937-05-23 | 1937-05-29 | 0 |
| 108348 | TAMPA | 1937-05-23 | 1937-05-29 | 0 |
| 151371 | TACOMA | 1937-05-23 | 1937-05-29 | 0 |
| 181276 | ST. JOSEPH | 1937-05-23 | 1937-05-29 | 0 |
| 132556 | SPOKANE | 1937-05-23 | 1937-05-29 | 0 |
| 109846 | SHREVEPORT | 1937-05-23 | 1937-05-29 | 0 |
| 131340 | SEATTLE | 1937-05-23 | 1937-05-29 | 0 |
| ... | ... | ... | ... | ... |
| 99128 | MOBILE | 1937-05-23 | 1937-05-29 | 0 |
| 172800 | MISSOULA | 1937-05-23 | 1937-05-29 | 0 |
| 216533 | MINOT | 1937-05-23 | 1937-05-29 | 0 |
| 217690 | MIAMI | 1937-05-23 | 1937-05-29 | 0 |
| 113133 | MEMPHIS | 1937-05-23 | 1937-05-29 | 0 |
| 123539 | LYNCHBURG | 1937-05-23 | 1937-05-29 | 0 |
| 89258 | LOUISVILLE | 1937-05-23 | 1937-05-29 | 0 |
| 187396 | LEXINGTON | 1937-05-23 | 1937-05-29 | 0 |
| 183608 | LAWRENCE | 1937-05-23 | 1937-05-29 | 0 |
| 204925 | LAKE CHARLES | 1937-05-23 | 1937-05-29 | 0 |
| 122291 | KNOXVILLE | 1937-05-23 | 1937-05-29 | 0 |
| 72164 | KANSAS CITY | 1937-05-23 | 1937-05-29 | 0 |
| 130258 | HOUSTON | 1937-05-23 | 1937-05-29 | 0 |
| 144754 | HELENA | 1937-05-23 | 1937-05-29 | 0 |
| 168618 | GREENVILLE | 1937-05-23 | 1937-05-29 | 0 |
| 182846 | GREAT FALLS | 1937-05-23 | 1937-05-29 | 0 |
| 94199 | GALVESTON | 1937-05-23 | 1937-05-29 | 0 |
| 135563 | FREDERICK | 1937-05-23 | 1937-05-29 | 0 |
| 127075 | FORT WORTH | 1937-05-23 | 1937-05-29 | 0 |
| 206745 | FLORENCE | 1937-05-23 | 1937-05-29 | 0 |
| 193250 | FARGO | 1937-05-23 | 1937-05-29 | 0 |
| 75637 | DENVER | 1937-05-23 | 1937-05-29 | 0 |
| 114894 | CUMBERLAND | 1937-05-23 | 1937-05-29 | 0 |
| 184782 | COVINGTON | 1937-05-23 | 1937-05-29 | 0 |
| 194271 | COLORADO SPRINGS | 1937-05-23 | 1937-05-29 | 0 |
| 56246 | CHARLESTON | 1937-05-23 | 1937-05-29 | 0 |
| 200854 | CHARLESTON | 1937-05-23 | 1937-05-29 | 0 |
| 119862 | BRUNSWICK | 1937-05-23 | 1937-05-29 | 0 |
| 204261 | BILLINGS | 1937-05-23 | 1937-05-29 | 0 |
| 156074 | ALBUQUERQUE | 1937-05-23 | 1937-05-29 | 0 |
72 rows × 4 columns
Overlapping Data Example
Picking rows in the overlapping dateranges as an example:
ex_1 = (df.CityName == 'NEWARK') &(df.PeriodStartDate >= '1923-11-01') &(df.PeriodStartDate <= '1923-11-15')
ex_2 = (df.CityName == 'LOS ANGELES') &(df.PeriodStartDate >= '1937-05-15') &(df.PeriodStartDate <= '1937-05-31')
ex_3 = (df.CityName == 'CLEVELAND') &(df.PeriodStartDate >= '1923-11-01') &(df.PeriodStartDate <= '1923-11-30')
df.loc[ex_1 | ex_2 | ex_3].sort_values(by=[
    'CityName',
    'Fatalities',
    'PeriodStartDate'
])[['CityName', 'PeriodStartDate', 'PeriodEndDate', 'CountValue']]
| CityName | PeriodStartDate | PeriodEndDate | CountValue | |
|---|---|---|---|---|
| 45321 | CLEVELAND | 1923-11-04 | 1923-11-10 | 3 |
| 45322 | CLEVELAND | 1923-11-05 | 1923-11-11 | 8 |
| 45323 | CLEVELAND | 1923-11-18 | 1923-11-24 | 6 |
| 45324 | CLEVELAND | 1923-11-25 | 1923-12-01 | 4 |
| 46535 | CLEVELAND | 1923-11-04 | 1923-11-10 | 1 |
| 46536 | CLEVELAND | 1923-11-11 | 1923-11-17 | 2 |
| 169693 | LOS ANGELES | 1937-05-17 | 1937-05-23 | 8 |
| 169694 | LOS ANGELES | 1937-05-23 | 1937-05-29 | 15 |
| 169695 | LOS ANGELES | 1937-05-30 | 1937-06-05 | 5 |
| 170995 | LOS ANGELES | 1937-05-17 | 1937-05-23 | 0 |
| 170996 | LOS ANGELES | 1937-05-23 | 1937-05-29 | 1 |
| 170997 | LOS ANGELES | 1937-05-30 | 1937-06-05 | 2 |
| 99913 | NEWARK | 1923-11-04 | 1923-11-10 | 11 |
| 99914 | NEWARK | 1923-11-05 | 1923-11-11 | 7 |
Sanitizing Overlapping Rows
As described in the dataset readme:
- Cumulative case count time series consist of overlapping case count intervals starting on the same date, but ending on different dates.
- For example, each interval in a cumulative count time series can start on January 1st, but end on January 7th, 14th, 21st, etc.
- It is common practice among public health agencies to report cases for cumulative time intervals.
We find:
- Between
"1923-11-04","1923-11-10"there were11reported non-fatal counts of Influenza in Birmingham. - Between
"1923-11-05","1923-11-11"there were7reported non-fatal counts of Influenza in Birmingham.
We can only be sure that between 1923-11-04 - 1923-11-11 there were between [11,18] (inclusive) counts of influenza recorded in Newark.
More generally:
- Given possibly overlapping date ranges
[d1, d2], [d3, d4], ...and instance countsc1, c2, c3, ... - We can be sure in the date range
[min(d1,d2,d3,...), max(d1,d2,d3,...)]
- there are between
[max(c1,c2,c3...), sum(c1,c2,c3,c4...)]disease instance counts.*
- We decide to pick the worst case (sum ) of the range - though you could also pick the average or minimum.
to_drop = [combine_rows(prev, cur, df) for prev, cur in overlaps(df, match_on, sort_by)]
df.drop(to_drop, inplace=True)
Test and Verify Sanitizing Worked
found = overlaps(df, match_on, sort_by)
try:
    print(next(found))
except StopIteration:
    print("No overlaps found!")
No overlaps found!
Visualizing The Data
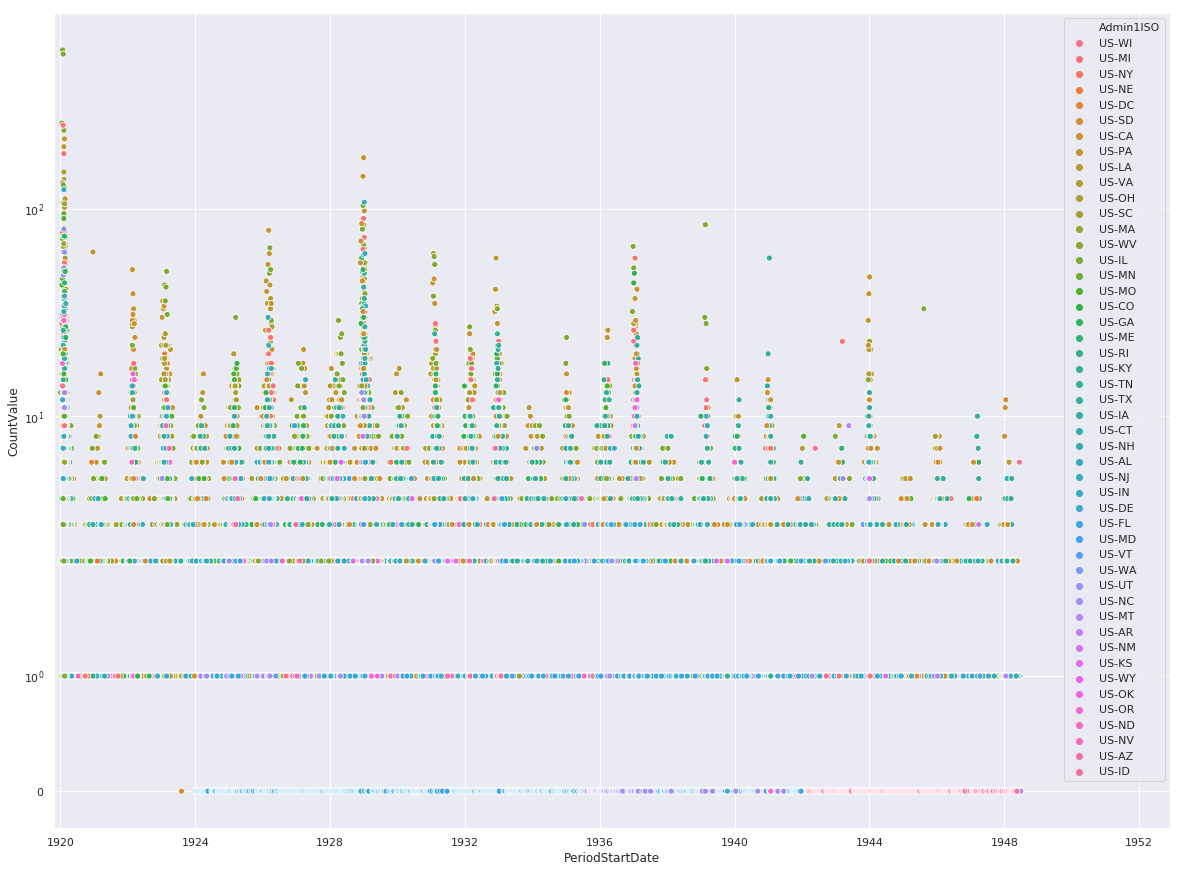
Fatal Instances of Influenza
import seaborn as sns
import matplotlib.pyplot as plt

%matplotlib inline

sns.set(rc={'figure.figsize':(20,15)})

ax = sns.scatterplot(
    x='PeriodStartDate',
    y='CountValue',
    hue='Admin1ISO',
    data=df[df.Fatalities == 1]
)

ax.set_yscale('symlog')
ax.set(xlim=(min(df.PeriodStartDate), max(df.PeriodStartDate) + pandas.DateOffset(years=1)))

plt.show()
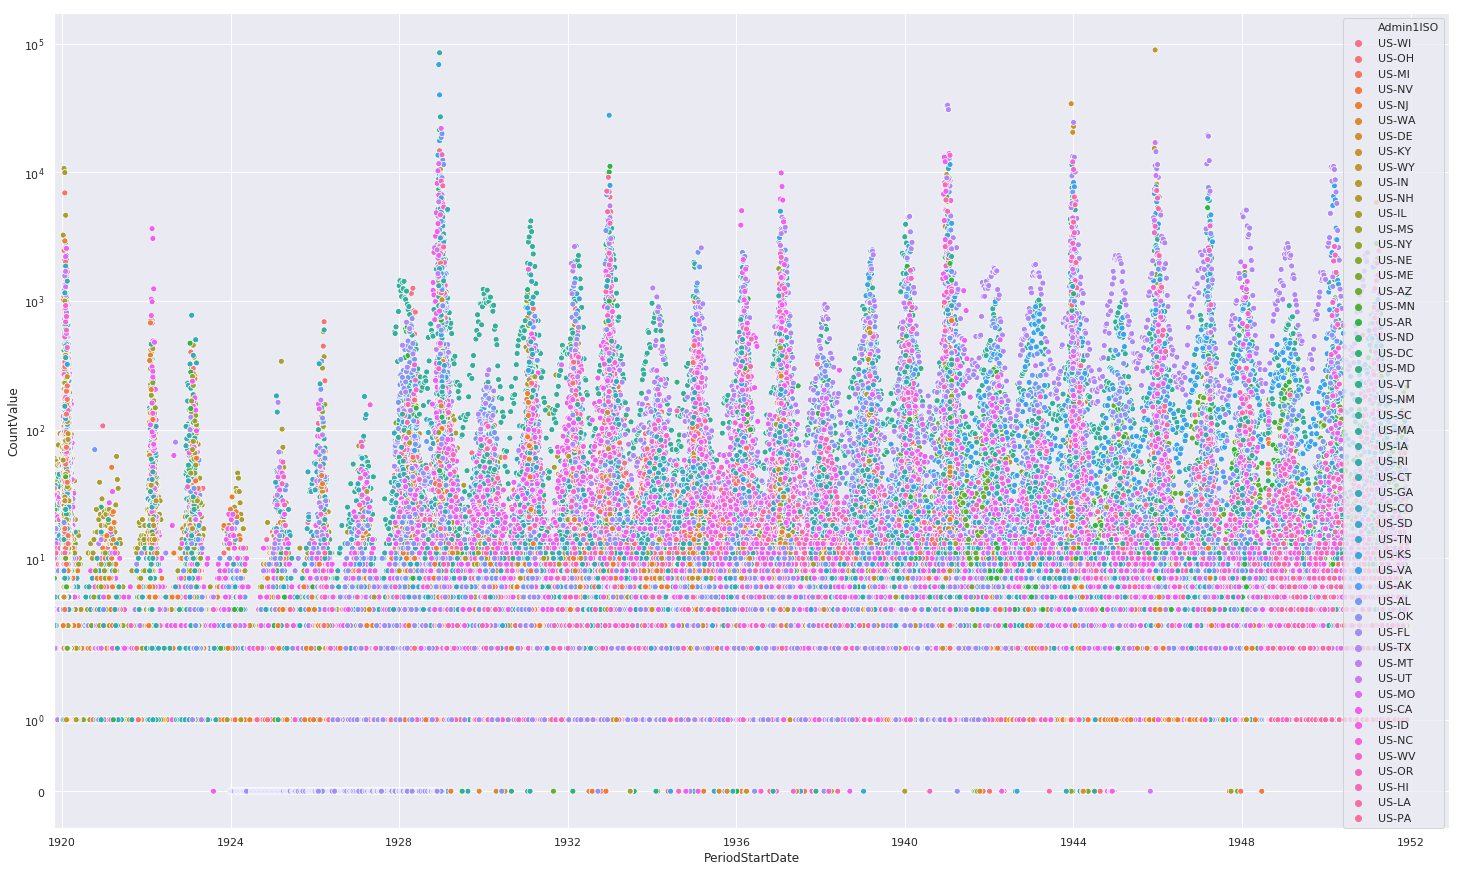
Non-Fatal Instances of Influenza
%matplotlib inline

sns.set(rc={'figure.figsize':(25,15)})

ax = sns.scatterplot(
    x='PeriodStartDate',
    y='CountValue',
    hue='Admin1ISO',
    data=df[df.Fatalities == 0]
)

ax.set_yscale('symlog')
ax.set(xlim=(min(df.PeriodStartDate), max(df.PeriodStartDate) + pandas.DateOffset(years=1)))

plt.show()
Combined Fatal and Non-Fatal Instances of Influenza
%matplotlib inline

sns.set(rc={'figure.figsize':(20,15)})

ax = sns.scatterplot(
    x='PeriodStartDate',
    y='CountValue',
    hue='Admin1ISO',
    data=df
)

ax.set_yscale('symlog')
ax.set(xlim=(min(df.PeriodStartDate), max(df.PeriodStartDate) + pandas.DateOffset(years=1)))

plt.show()
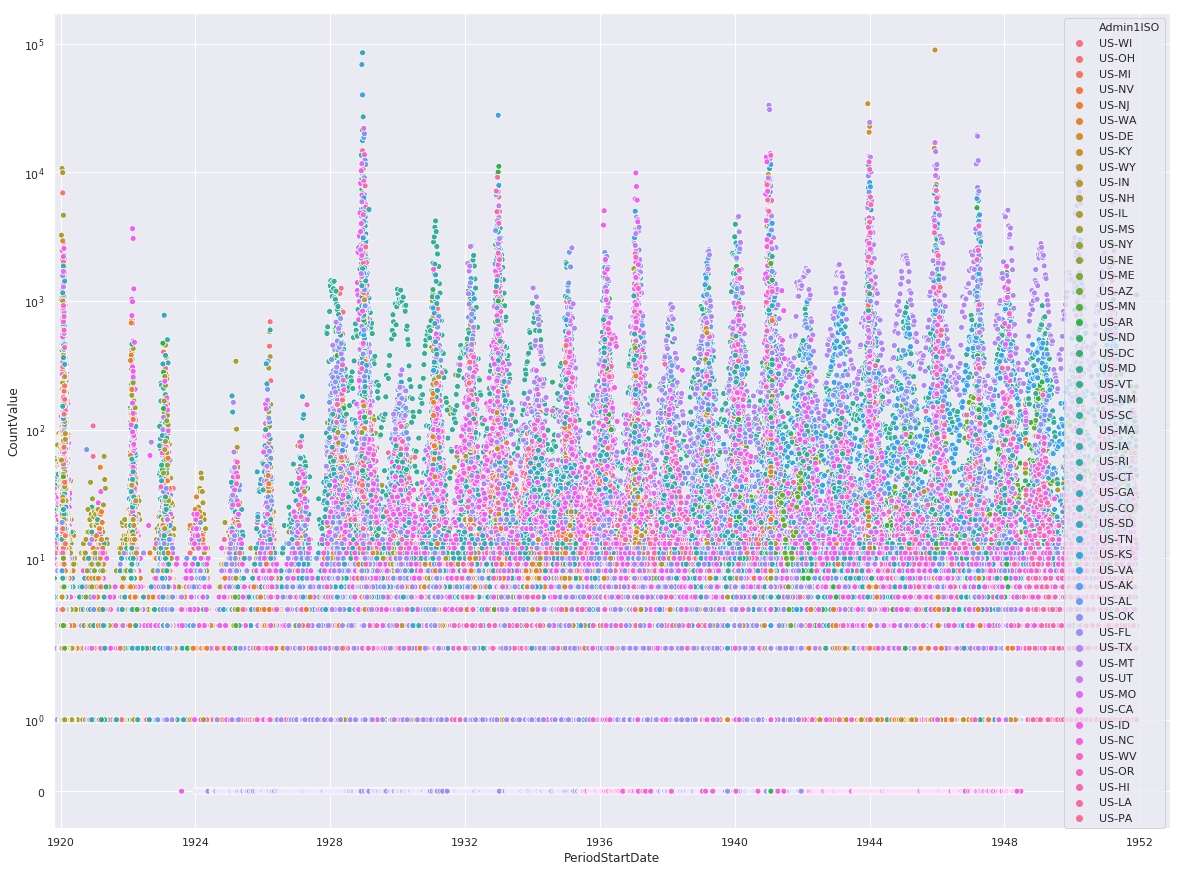
Preserving Datapoint Magnitudes
The above scatter plots mask an important piece of information, namely two states with similiar count values will overlap and mask the magnitudes. We can overcome this by using a heatmap.
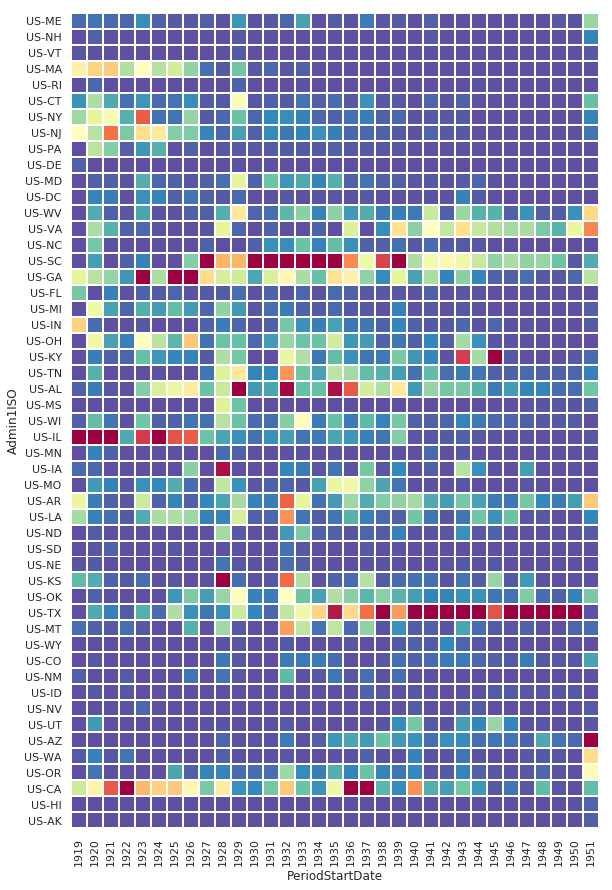
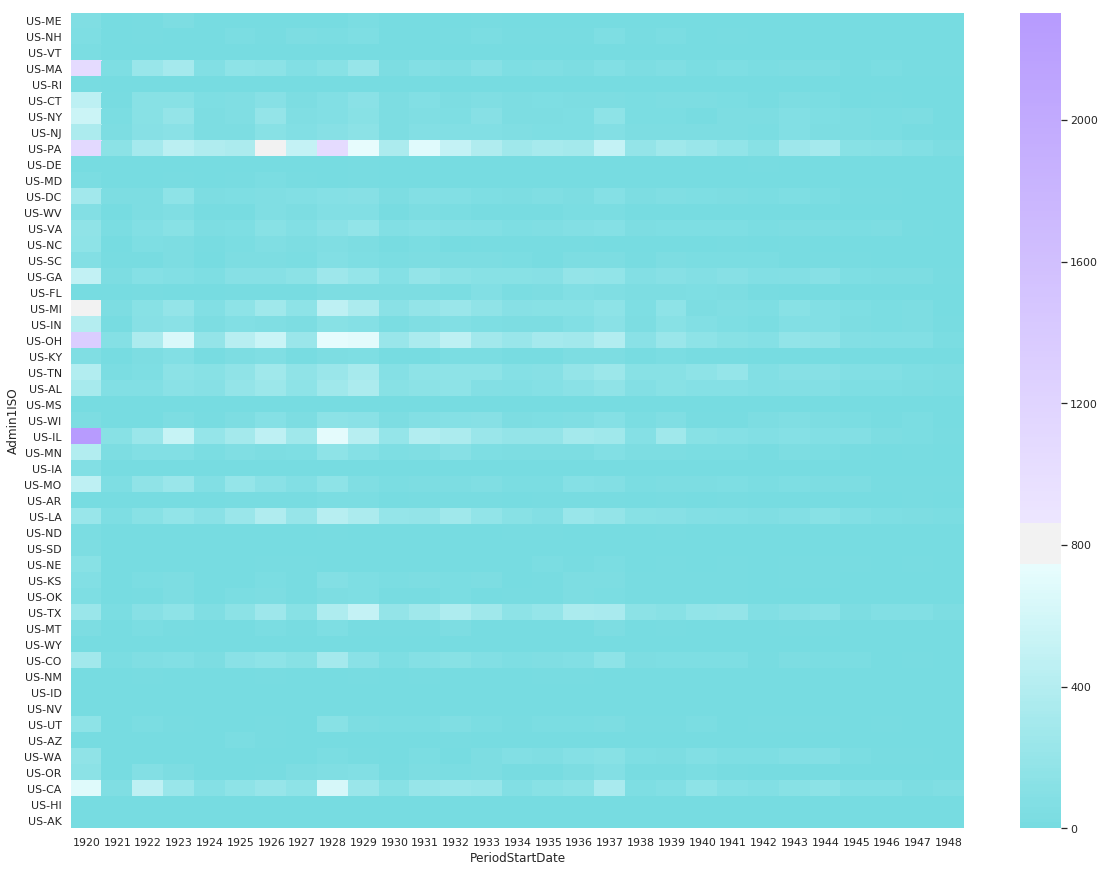
Fatal Instances of Influenza Heatmap
We start by pivoting on the state and year, and aggregating on the fatal CountValue’s. We will also order the states from east to west geographically.
states_east_to_west = [
    'US-ME', 'US-NH', 'US-VT', 'US-MA', 'US-RI', 'US-CT', 'US-NY', 'US-NJ', 'US-PA', 'US-DE', 'US-MD', 'US-DC',
    'US-WV', 'US-VA', 'US-NC', 'US-SC', 'US-GA', 'US-FL',
    'US-MI', 'US-IN', 'US-OH', 'US-KY', 'US-TN', 'US-AL', 'US-MS',
    'US-WI', 'US-IL',
    'US-MN', 'US-IA', 'US-MO', 'US-AR', 'US-LA',
    'US-ND', 'US-SD', 'US-NE', 'US-KS', 'US-OK', 'US-TX',
    'US-MT', 'US-WY', 'US-CO', 'US-NM',
    'US-ID', 'US-NV', 'US-UT', 'US-AZ',
    'US-WA', 'US-OR', 'US-CA',
    'US-HI', 'US-AK'


]
df_pv = df[df.Fatalities == 1].groupby(['Admin1ISO', df['PeriodStartDate'].dt.year])['CountValue'].sum()
df_pv = df_pv.reset_index().pivot('Admin1ISO','PeriodStartDate', 'CountValue').reindex(states_east_to_west, axis=0).fillna(0)

sns.heatmap(
    df_pv,
    cmap=sns.diverging_palette(200, 275, s=99, l=70, as_cmap=True),
    center=800
)
<matplotlib.axes._subplots.AxesSubplot at 0x105c8fb00>
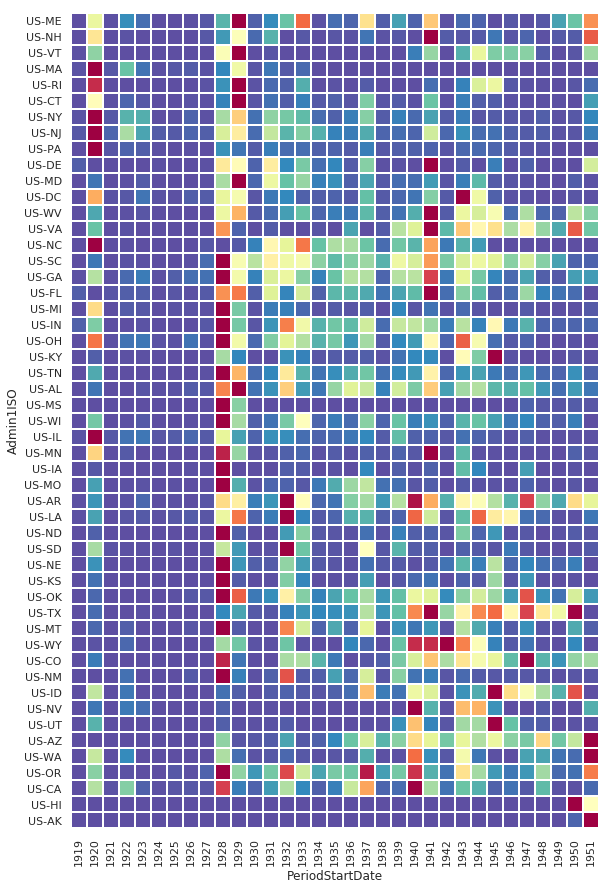
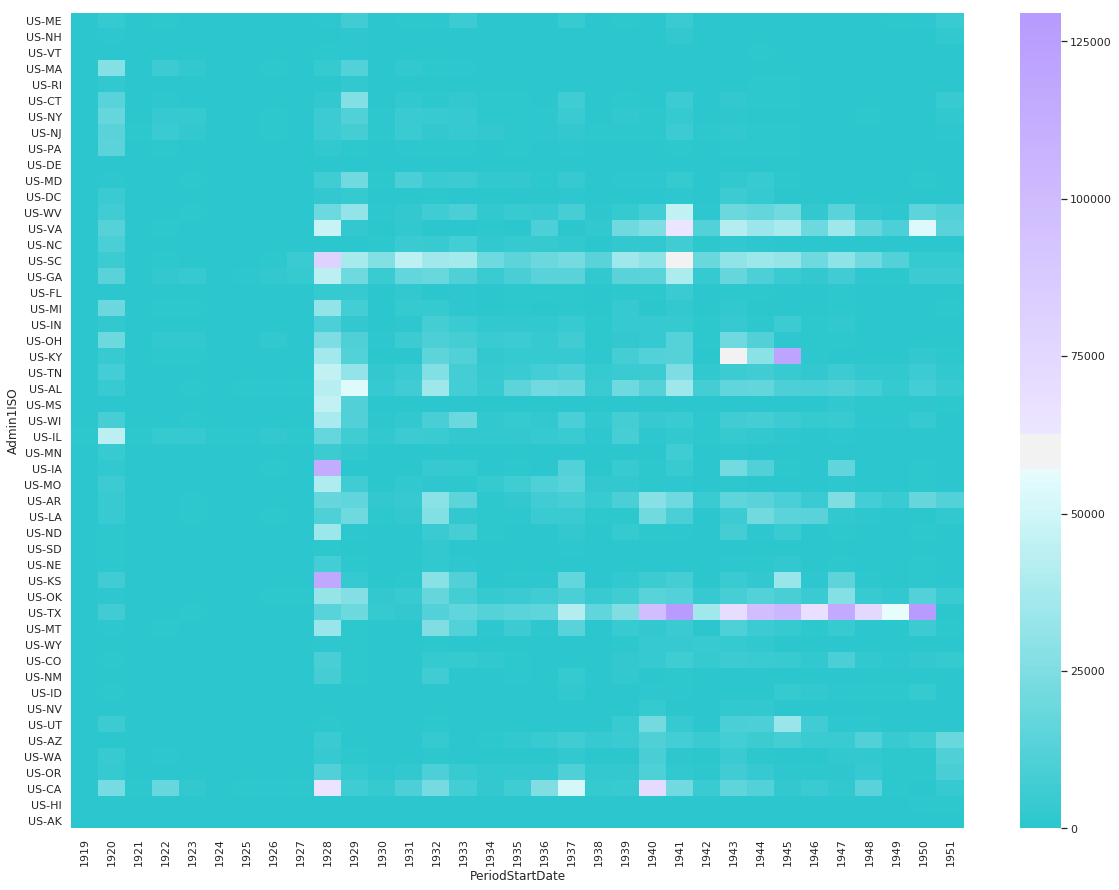
Non-Fatal Instances of Influenza Heatmap
df_pv = df[df.Fatalities == 0].groupby(['Admin1ISO', df['PeriodStartDate'].dt.year])['CountValue'].sum()
df_pv = df_pv.reset_index().pivot('Admin1ISO','PeriodStartDate', 'CountValue').reindex(states_east_to_west, axis=0).fillna(0)

sns.heatmap(
    df_pv,
    cmap=sns.diverging_palette(200, 275, s=99, l=70, as_cmap=True),
    center=60000
)
<matplotlib.axes._subplots.AxesSubplot at 0x1174f7668>

Combined Fatal and Non-Fatal Instances of Influenza
df_pv = df[df.Fatalities == 0].groupby(['Admin1ISO', df['PeriodStartDate'].dt.year])['CountValue'].sum()
df_pv = df_pv.reset_index().pivot('Admin1ISO','PeriodStartDate', 'CountValue').reindex(states_east_to_west, axis=0).fillna(0)

sns.heatmap(
    df_pv,
    cmap=sns.diverging_palette(200, 275, s=99, l=70, as_cmap=True),
    center=60000
)
<matplotlib.axes._subplots.AxesSubplot at 0x11152f6a0>
Code And Other Snippets
# %load src/lib/parse.py
def between(s, e, d):
    return s <= d <= e


def is_row_between(prev, cur, match_on):
    """
        returns if the date range of prev
        has any overlap
        with the date range cur
        and if they have matching match_on values
    """
    (_, r1), (_, r2) = prev, cur
    d1 = (r1.PeriodStartDate, r1.PeriodEndDate, r2.PeriodStartDate)
    d2 = (r1.PeriodStartDate, r1.PeriodEndDate, r2.PeriodEndDate)
    return all(r1[m] == r2[m] for m in match_on) and (between(*d1) or between(*d2))


def iter_with_prev(df):
    """
        return an iterator that gives back a tuple on next
        ((i, previous_row), (i+1, previous_row))
        first value is ((0, df[0]), (1, df[1]))
    """
    try:
        rows = df.iterrows()
        prev, curr = next(rows), next(rows)
        yield prev, curr
        prev = curr
        for row in rows:
            yield prev, row
            prev = row
    except StopIteration: # could yield back ((1, df[1]), None) ?
        pass


def combine_rows(prev, cur, df): #, r2_i, df
    """
        combines the two rows into r2, drops r_1
            date range is smallest date range that includes r1 & r2
            count is sum(counts) (the worst caste)
                this could be avg, min, max etc.
        returns the index of the previous row
    """
    (r1_i, r1), (r2_i, r2) = prev, cur
    dates = (r1.PeriodStartDate, r1.PeriodEndDate, r2.PeriodStartDate, r2.PeriodEndDate)
    counts = (r1.CountValue, r2.CountValue)
    df.at[r2_i, 'PeriodStartDate'] = min(*dates)
    df.at[r2_i, 'PeriodEndDate'] = max(*dates)
    df.at[r2_i, 'CountValue'] = sum(counts)
    return r1_i


def overlaps(df, match_on, sort_by):
    """
        yields the previous and current row
        given rows to match on, sort by and a data frame
    """
    for prev, curr in iter_with_prev(df.sort_values(by=match_on + sort_by)):
        if is_row_between(prev, curr, match_on):
            yield prev, curr
df_pv2 = df_pv.div(df_pv.max(axis=1), axis=0)

sns.heatmap(
    df_pv2,
    cmap = 'Spectral_r',
    linewidths=1,
    square=True,
    cbar=False
)
<matplotlib.axes._subplots.AxesSubplot at 0x133215e48>
df_pv2 = df_pv.div(df_pv.max(axis=0), axis=1)

sns.heatmap(
    df_pv2,
    cmap = 'Spectral_r',
    linewidths=1,
    square=True,
    cbar=False
)
<matplotlib.axes._subplots.AxesSubplot at 0x11473c198>